Seasonality360 Methodology
Process, validation criteria, and robustness principles for data-driven seasonal analysis.
Seasonality360 Methodology: data-driven seasonal analysis
English methodology with focus on statistical transparency and risk-aware process quality.
Quick web app access
Our Methodology
How Seasonality360 approaches market seasonality — with rigor, transparency, and realistic expectations.
You can apply this framework directly inside the web app with Screener, Backtest, Radar, and Memo Notes.
What Is Market Seasonality?
Market seasonality refers to recurring, calendar-based patterns in financial markets. These patterns are linked to the calendar rather than to classic technical indicators and can be driven by institutional flows (for example, end-of-quarter rebalancing), tax-related selling, agricultural harvest cycles, holiday effects, and recurring behavioral tendencies.
Well-known examples include the “Sell in May and Go Away” effect, the Santa Claus Rally, and the January Effect. While they are widely discussed in books, blogs, and social media, very few tools allow traders to systematically validate these effects with hard data, robust statistics, and transparent metrics.
Seasonality360 exists exactly for this reason: to turn market seasonality from folklore into testable, data-driven hypotheses.
How Seasonality360 Uses Data
Seasonality360 analyzes long histories of price data for each instrument (typically 15–30+ years where available). For each asset we:
- normalize and clean historical prices (open, high, low, close, and in some cases intraday data),
- compute seasonal returns for different calendar windows (months, weeks, specific day ranges),
- aggregate results in a way that highlights both average behavior and variability.
Rather than just showing raw returns, we:
- rank patterns by win rate (percentage of positive periods),
- track average and median returns,
- compute maximum drawdown and other risk indicators,
- look at the full distribution of outcomes (not just the “nice” years).
Our backtesting engine simulates a year-by-year replay of each pattern, reporting:
- number of trades / seasonal occurrences,
- win rate and loss rate,
- average and median return,
- best and worst year,
- maximum drawdown,
- basic distribution metrics so you can see how “smooth” or “lumpy” the pattern has been.
The result is a framework where seasonal edges are quantified, not just claimed.
Data Coverage & Universes
Seasonality360 is designed to work across multiple markets and asset classes, such as:
- major stock indices and single stocks,
- Forex pairs,
- commodities and precious metals,
- in some configurations, crypto and other assets linked to CFDs or futures.
For each universe we aim to:
- use reliable historical data from established providers,
- stretch the history as far back as practically useful,
- keep a consistent data scheme so that seasonal metrics mean the same thing across markets.
This multi-asset approach allows you to:
- compare seasonal behavior across indices, FX and commodities,
- build portfolios of seasonal strategies that are not all concentrated on the same risk factor,
- see whether a given seasonal effect appears in just one market or is more broadly present.
How We Build Seasonal Patterns
At the core of Seasonality360 there is a simple question:
“If I had systematically traded this calendar effect in the past, what would have happened?”
To answer that, we construct seasonal patterns following a few clear steps:
-
Define the calendar window
- Examples:
- first 5 trading days of the month (turn-of-the-month effect),
- last week of December + first trading days of January (Santa Claus Rally),
- a specific month or group of months (e.g. September for equity indices, summer for commodities).
- Examples:
-
Apply the same rule year by year
- For each year in the dataset, we identify the dates that match the rule (for example: last 5 trading days of December and first 2 of January).
- We compute the return over that window using a simple, transparent logic (e.g. close-to-close or open-to-close, depending on the pattern type).
-
Aggregate results
- We collect all yearly outcomes for that pattern.
- We compute:
- how often the pattern was positive vs negative,
- average and median return,
- best and worst occurrences,
- drawdowns along the way.
-
Visualize the seasonality
- A typical seasonal chart shows:
- the average path of the instrument over the year,
- sometimes the percentile bands (for example, interquartile range),
- key seasonal windows highlighted so you can quickly see where the pattern lives.
- A typical seasonal chart shows:
Throughout this process, the rule is always the same: no hindsight tricks.
We only use information that would have been available at the time of each trade.
Methodology Visual
How Backtests Work in Seasonality360
Seasonality360 includes a backtesting engine that extends the seasonal logic into full strategy tests.
Conceptually, a backtest in our platform follows these principles:
-
Rule-based: the strategy is defined by clear, repeatable rules (entry, exit, holding period, filters). Seasonal windows are one possible component; you can test “seasonal only” ideas or combine them with other types of conditions.
-
Chronological replay: we simulate the strategy year by year, trade by trade, as if you had executed the rules in real time.
-
Portfolio-level measures: the platform calculates:
- equity curves,
- drawdowns,
- hit ratio (win rate),
- payoff ratio,
- sequences of wins and losses,
- exposure over time where applicable.
For seasonal patterns specifically, the backtest ensures that:
- every trade is triggered by a calendar condition (e.g. timeframe in the year),
- exits follow pre-defined rules (for example after N days, or at the end of the seasonal window),
- transaction costs and other practical considerations can be included where relevant in the configuration (depending on your use case).
Backtesting does not predict the future, but it forces an idea to “survive contact with reality” in historical data.
Portfolio Backtest Management
Real trading rarely relies on a single “hero” strategy.
Seasonality360 includes Portfolio Backtest Management to help you reason in terms of groups of edges, not isolated trades.
With this module you can:
- combine multiple seasonal strategies or patterns,
- assign weights or capital allocation rules to each strategy,
- see how the combined equity curve would have behaved over time,
- analyze the contribution of each component in terms of return and drawdown.
This is especially helpful if you:
- want to design a diversified approach for your own account, or
- need a structured portfolio of strategies for prop firm challenges or institutional evaluation.
Again, Seasonality360 does not tell you which portfolio you “should” run.
It gives you the tools to simulate, compare and stress-test different configurations so the final decision is an informed one.
Process Diagram
Robustness and Avoiding Overfitting
Any methodology that looks for patterns in historical data faces a key risk: overfitting.
Overfitting happens when:
- a pattern looks great on past data,
- but only because it was tailored too closely to that specific sample,
- and therefore fails quickly when applied to new data.
Seasonality360’s philosophy is to highlight this risk, not hide it.
We encourage users to:
- be skeptical of patterns with:
- very few occurrences,
- extremely high returns but also very violent drawdowns,
- hyper-precise date ranges that “just happen” to work perfectly in sample;
- prefer patterns that:
- have a reasonable number of years / trades behind them,
- show consistent behavior across different regimes,
- still make sense from a market logic perspective (flows, fundamentals, behavior).
In the platform, this translates into:
- clear visibility of the number of historical occurrences,
- year-by-year breakdowns rather than only long-term averages,
- risk metrics that discourage “falling in love” with a beautiful but fragile curve.
Seasonality360 does not automatically “fix” overfitting.
Instead, it is designed to make fragile patterns visible, so you can consciously downgrade or discard them.
How to Read Seasonality360 Metrics
When you look at patterns or backtests in Seasonality360, you will typically see:
- Win rate: percentage of positive trades or seasonal windows.
- High win rate with very asymmetric losses may still be uncomfortable.
- Average and median return: the mean can be skewed by a few extreme years; the median helps you see the “typical” outcome.
- Maximum drawdown: how deep the worst historical equity drop has been.
- Number of occurrences: how many times the pattern actually triggered.
- Distribution of returns: where most of the years/trades cluster (tight distribution vs wild scattering).
A few practical guidelines:
- A 95% win rate on only a handful of trades is less meaningful than a 65–70% win rate over dozens of occurrences.
- A pattern with a smooth distribution and moderate drawdown is often more usable than one with huge theoretical returns but violent equity swings.
- Comparing different patterns on the same metric set (win rate, return, drawdown) helps you prioritize objectively.
Seasonality360 is built to put these metrics front and center, so you can build your own internal sense of what “good enough” means for your style and constraints.
What Seasonality360 Is NOT
We are not a signal service.
We do not tell you what to buy or sell.
We provide analytical tools that let you form, test, and validate your own hypotheses about seasonal market behavior.
Past seasonal patterns do not guarantee future results.
Overfitting to historical data is a real risk that we actively educate our users about.
Seasonality360 is a study and research tool: turning any idea into real trades on your account is always your decision and your responsibility.
We also:
- do not manage money on behalf of users,
- do not execute trades on your brokerage account,
- do not receive commissions depending on how often or on what you trade.
Our incentive is aligned with clarity and robustness of analysis, not with pushing you to overtrade.
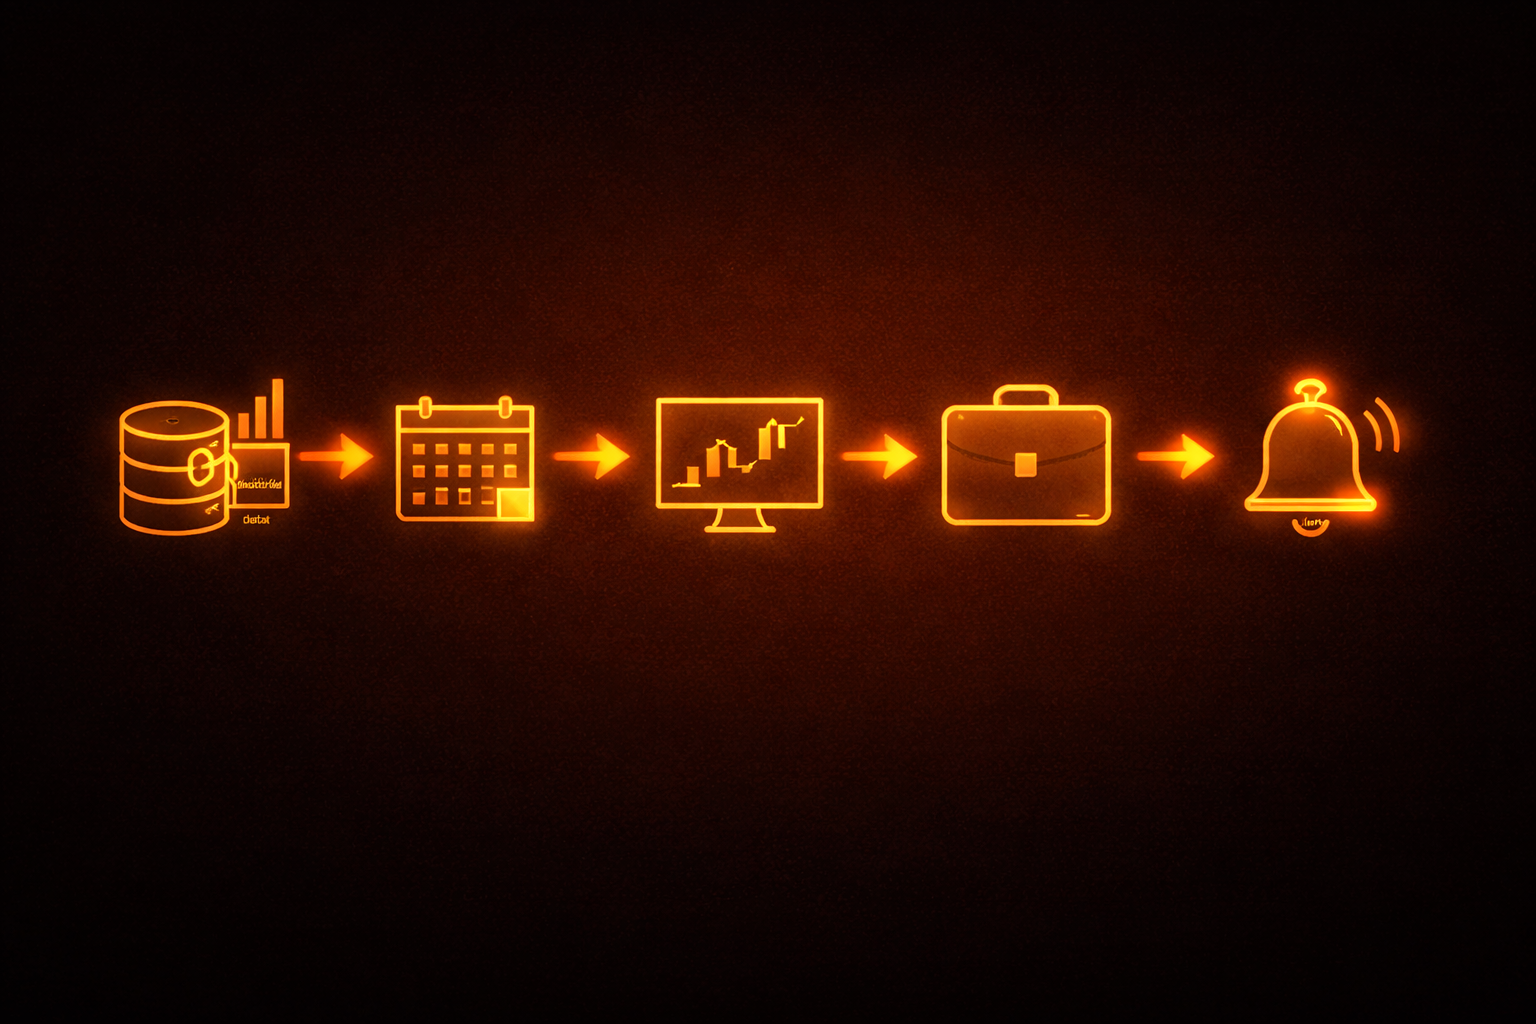
How the Methodology Connects to the App
The methodology described on this page is not abstract.
It drives the design and behavior of the core modules inside Seasonality360:
-
Screener
Uses the seasonal logic and metrics above to scan many instruments at once and surface the most interesting patterns for your filters. Open Screener in the web app. -
Backtest
Applies the rule-based, chronological replay engine to your seasonal and non-seasonal ideas, so you can see trade-by-trade results and risk. Open Backtest in the web app. -
Portfolio Backtest Management
Lets you combine multiple strategies and patterns into a single equity curve, with aggregated risk metrics and detailed contribution analysis. Open Portfolio workflow in the web app. -
Radar & Alerts
Take seasonal knowledge from "static" to "actionable": once you know a pattern and have tested it, Radar and Alerts help you monitor when those conditions are approaching or active in the current calendar. Open Radar and Memo Notes in the web app.
In other words, the app is the practical interface of the methodology: the same principles you see here are applied in every chart, table and report.
Final Disclaimer
Seasonality360 is a platform for analysis and visualization of historical market data.
The information provided on this page and throughout the site is for informational and educational purposes only and does not constitute financial advice, a solicitation to invest, or personalized investment recommendations.
Trading in financial markets involves a high level of risk and may not be suitable for all investors.
Past performance, whether real or simulated, is not a guarantee of future results.
Any decision to open, modify or close a position remains entirely under your own responsibility.