Seasonality trading and seasonal patterns
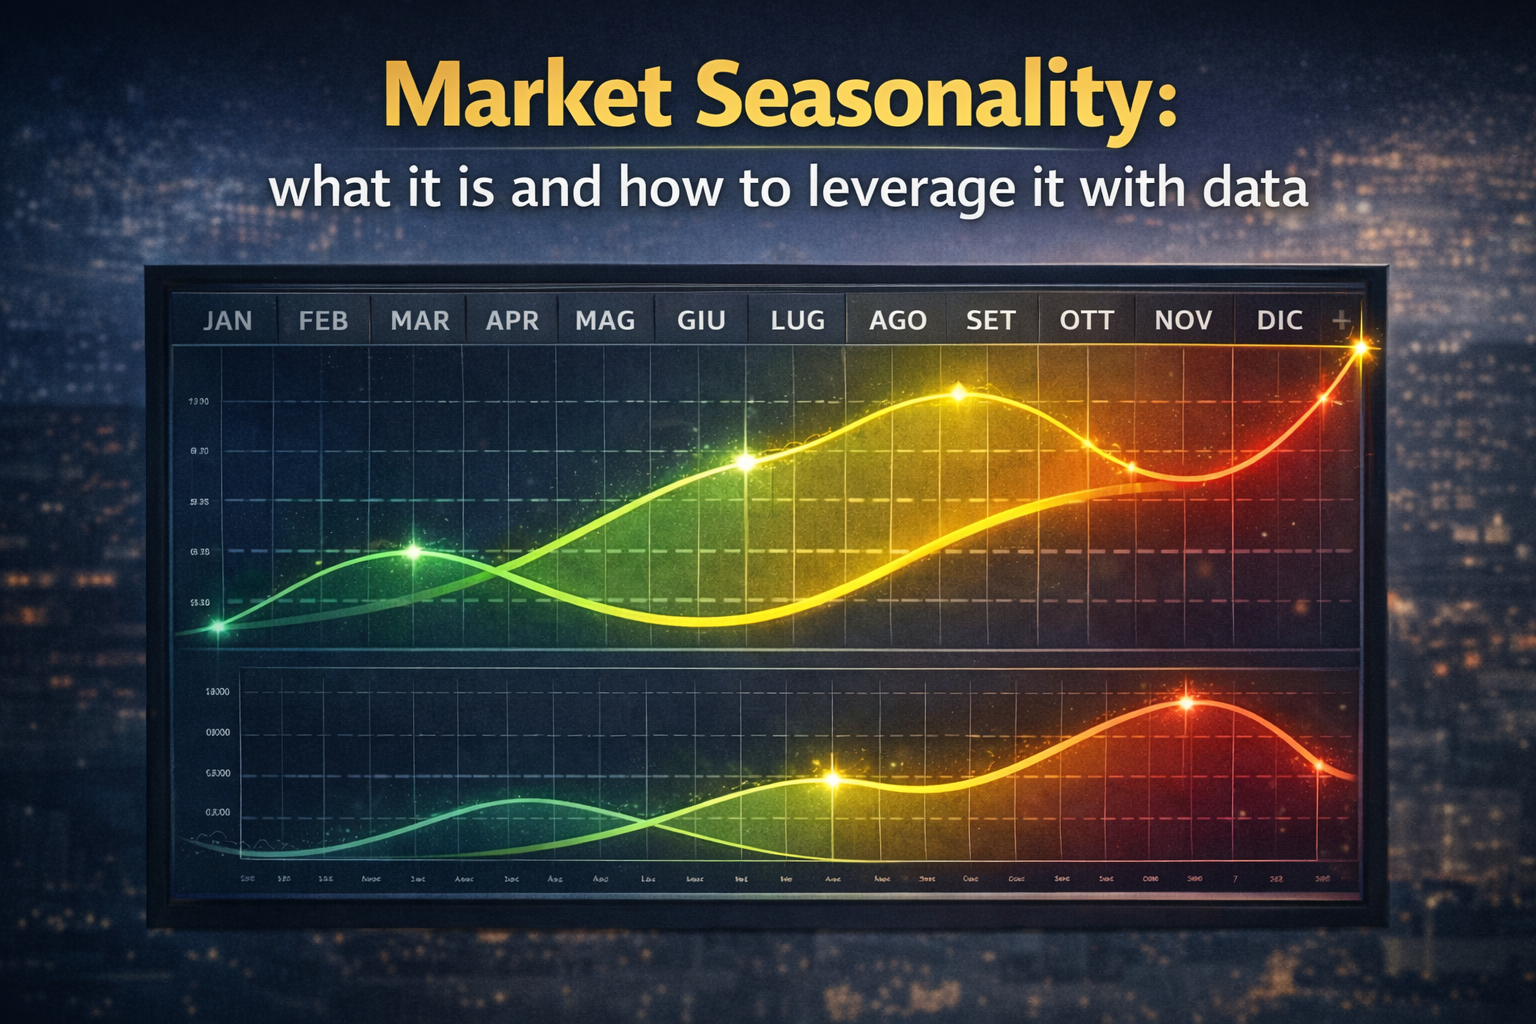
Seasonality trading and seasonal patterns with real data
Everyone talks about January effect, Santa Claus rally and Sell in May.
Very few traders actually check whether these seasonal patterns still work.
Seasonality360 is a seasonal trading research platform that lets you:
- map seasonal patterns across forex, indices, stocks and more,
- analyse forex seasonality and EURUSD seasonal pattern behaviour over 10-20+ years,
- turn calendar effects into seasonal trading strategies with real backtests.
Seasonality trading is not about magic dates. It's about statistics and context.
Explore seasonal charts and patterns before you risk capital.
Why most seasonality trading is just storytelling
Seasonal effects are attractive:
- "The market tends to rally in December."
- "This stock has a strong Q4."
- "EURUSD is weak in August."
The problem is how they're usually used:
- based on one chart or a cherry-picked period,
- without checking multiple years and regimes,
- with no trading strategy or risk management attached.
This leads to:
- entries just because "it's that time of the year",
- disappointment when the pattern fails in a different macro environment,
- scepticism about seasonality as a whole.
Seasonality trading is not the issue.
The issue is using it without proper data and clear rules.
Why you need more than static seasonal charts
Static seasonal charts you find online are a starting point, not a solution.
They ignore risk
You might see that a period has a positive average, but:
- what is the max drawdown?
- how many losing years are there?
- how does it compare to just holding the market?
Without these answers, a seasonal pattern is just a nice story.
They don't connect to strategies
A chart is not a seasonal trading strategy.
- No clear entry & exit rules.
- No position sizing.
- No way to integrate with your existing forex trading strategies or index setups.
You need a way to turn "this period tends to go up" into rule-based strategies you can test and monitor.
They rarely cover anomalies consistently
Classic market anomalies like:
- January effect strategy
- Santa Claus rally trading strategy
- Sell in May strategy
are often shown as one-off charts with no consistent framework.
You want a seasonality trading platform that treats them as first-class objects you can analyse, not as trivia.
Seasonality360: from calendar effects to seasonal trading strategies
Seasonality360 is designed to make seasonality trading practical:
-
Seasonal Screener
Scan markets for seasonal patterns: recurring windows with attractive stats (win rate, average return, drawdown). -
Seasonal charts with backtests behind them
For each pattern you can:- view the multi-year seasonal chart,
- open a full backtest with day-by-day equity curve,
- see how many years it worked and when it didn't.
-
From pattern to strategy
Combine the seasonal window with your own filters:- trend filters,
- volatility filters,
- basic rules you already use.
You move from "calendar effect" to seasonality strategy with clear logic.
-
Multi-market, multi-regime
Explore forex seasonality, seasonal stock strategy ideas and index effects in one place, so you can see where seasonality is strongest.
How it works
1. Choose your market and seasonal horizon
Start with the markets you actually trade:
- forex majors for forex seasonal patterns,
- indices for "risk-on / risk-off" seasonality,
- selected stocks and sectors for monthly seasonality trading ideas.
Select the horizon:
- specific months or weeks (e.g. "December effect"),
- custom date ranges (e.g. "end of month"),
- known seasonality anomalies you want to test.
2. Scan for seasonal patterns with edge
Use the Screener to find seasonal patterns that stand out:
- high win rate across many years,
- positive average return,
- controlled max drawdown.
You can quickly identify:
- if the EURUSD seasonal pattern around a certain month is worth attention,
- whether a market seasonality strategy on an index has held up across crises,
- which periods are better avoided altogether.
3. Open the seasonal backtest
For any pattern, open the full backtest view:
- see the equity curve built only from trades during that seasonal window,
- inspect year-by-year results (which years were bad, which were great),
- compare the pattern versus a simple buy-and-hold baseline.
This is where a pattern stops being a myth and becomes data.
4. Turn patterns into actionable seasonal strategies
Once you like a pattern, you can:
- define concrete rules (entry, exit, stop, sizing),
- combine it with your existing swing trading strategy or forex trading strategy,
- save it into your Seasonality360 Portfolio and Radar.
You now have a seasonal trading strategy you can monitor, not just a date on the calendar.
Use cases for seasonality trading
Exploit robust forex seasonality
If you trade forex, you can:
- explore forex seasonality on majors and crosses,
- see forex seasonal patterns like recurring strength or weakness in specific months,
- build seasonal forex strategy setups that align with your existing technical framework.
For example, you might discover that a certain EURUSD seasonality window historically aligns with stronger swings - and you can focus your forex swing trading strategy there.
Test famous equity anomalies properly
Instead of believing or dismissing market stories, you can:
- test January effect strategy on indices or stocks,
- analyse the Santa Claus rally trading strategy across multiple decades,
- check whether the Sell in May strategy holds in the data you care about.
Each anomaly becomes a pattern you can backtest and compare, not a meme.
Build seasonal stock and index rotations
If you manage a swing-oriented portfolio, you can:
- create seasonal stock strategy rotations (e.g. certain sectors in certain months),
- test market seasonality strategy ideas for indices,
- see whether a rotation adds value vs staying fully passive.
Seasonality360 helps you see which seasonal edges have actually persisted.
Use seasonality as context for discretionary trading
Even if you trade mostly discretionary:
- knowing whether you're in a historically strong or weak seasonal window can guide risk allocation,
- you can size up when seasonality and your signals align,
- or stay lighter when they conflict.
Seasonality trading doesn't replace your edge - it adds context.
Why traders use Seasonality360 for seasonal trading
- 20+ years of data for many markets, where available.
- True seasonal charts built from real historical prices.
- Backtests behind each pattern, not just pretty averages.
- Support for forex seasonality, indices and selected stocks.
- A workflow designed for seasonality trading, not just generic charts.
You get the tools to separate real, persistent seasonal patterns from noise.
Continue with related pages
- Validate logic with backtesting software.
- Scan opportunities in the seasonality screener.
- Explore FX examples in forex trading strategies.
FAQ
What is seasonality trading in practice?
Seasonality trading means exploiting recurring patterns in time - months, weeks, calendar effects - that show statistically different behaviour. In practice, it's about turning seasonal patterns into rule-based seasonal trading strategies with clear entries, exits and risk management.
How does Seasonality360 help with forex seasonality?
Seasonality360 lets you:
- scan forex seasonal patterns across major pairs,
- inspect EURUSD seasonal pattern behaviour over 10-20+ years,
- backtest trading only during specific seasonal windows.
You can then build and test seasonal forex strategy ideas before using them live.
Can I test famous anomalies like January effect or Santa Claus rally?
Yes. You can create and analyse:
- January effect strategy on indices or stocks,
- Santa Claus rally trading strategy around year-end,
- Sell in May strategy and other market anomalies.
Seasonality360 shows you equity curves, number of winning/losing years and drawdowns for each anomaly.
Is seasonality trading enough on its own?
Seasonality on its own is rarely a complete strategy.
The strength of Seasonality360 is that it lets you combine seasonal patterns with your existing methods - trend, momentum, mean reversion, discretionary setups - and backtest the result as a full trading strategy.
How is this different from a generic seasonal chart website?
Generic seasonal chart sites show you averages. Seasonality360:
- gives you a seasonality trading platform with Screener, backtests and tracking,
- lets you inspect yearly results and risk,
- helps you turn patterns into real seasonality strategies instead of just charts.
Ready to see which seasonal patterns actually deserve your attention?
Seasonality is not a magic trick - it's a way to add time-based structure to your trading.
Seasonality360 helps you discover, test and track seasonal trading strategies built on real data, not anecdotes.
Explore seasonal charts and backtests across forex, indices and stocks, and see which patterns are still worth trading today.
Ready to test this seasonal idea with real data?
Use Seasonality360 Screener and Backtest on 20+ years of history to turn seasonal patterns into a repeatable playbook.